This is part one, out of 5, focusing on the built-in Developer Tools in Firefox, their features and where we are now with them. The intention is to show you all the possibilities available, the progress and what we are aiming for.
Firefox 4 saw the launch of the Web Console, the first of the new developer tools built into Firefox. Since then we’ve been adding more capabilities to the developer tools, which now perform a wide range of functions and can be used to debug and analyze web applications on desktop Firefox, Firefox OS, and Firefox for Android.
This is the first in a series of posts in which we’ll look at where the developer tools have got to since Firefox 4. We’ll present each tool in a short screencast, then wrap things up with a couple of screencasts illustrating specific workflow patterns that should help you get the most of the developer tools. These will include scenarios such as mobile development, and altering and debugging CSS based applications, etc.
In this first post we present the latest Web Console and JavaScript Debugger.
Web Console
The Web Console is primarily used to display information associated with the currently loaded web page. This includes HTML, CSS, JavaScript, and Security warnings and errors. In addition network requests are displayed and the console indicates whether they succeeded or failed. When warnings and errors are detected the Web Console also offers a link to the line of code which caused the problem. Often the Web Console is the first stop in debugging a Web Application that is not performing correctly.
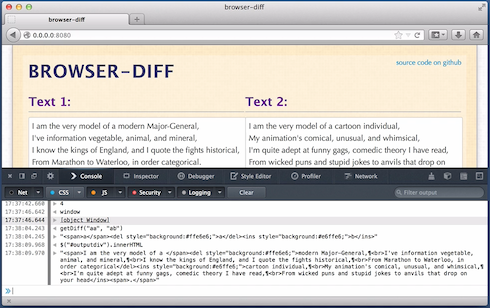
The Web Console also lets you execute JavaScript within the context of the page. This means you can inspect objects defined by the page, execute functions within the scope of the page, and access specific elements using CSS selectors. The following screencast presents an overview of the Web Console’s features.
Take a look at the MDN Web Console[1] documentation for more information.
JavaScript Debugger
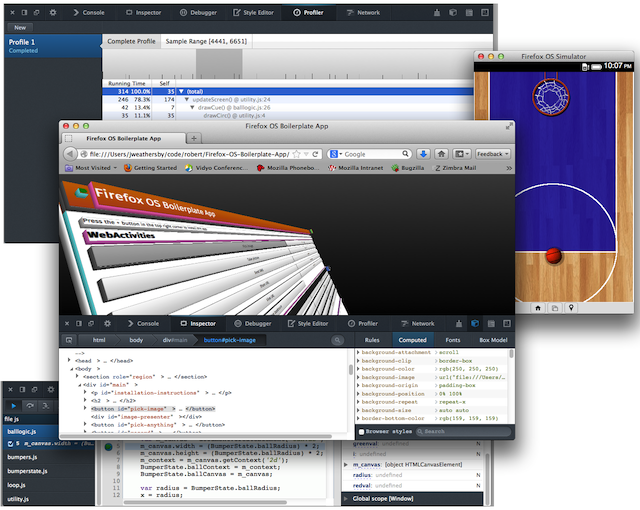
The JavaScript Debugger is used for debugging and refining JavaScript that your Web Application is currently using. The Debugger can be used to debug code running in Firefox OS and Firefox for Android, as well as Firefox Desktop. It’s a full-featured debugger providing watch expressions, scoped variables, breakpoints, conditional expressions, step-through, step-over and run to end functionality. In addition you can change the values of variables at run time while the debugger has paused your application.
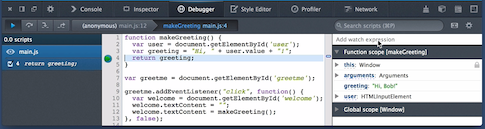
The following screencast illustrates some of the features of the JavaScript Debugger.
For more information on the JavaScript Debugger, see the MDN Debugger[2] documentation.
Learn More
These screencasts give a quick introduction to the main features of these tools. For the full details on all of the developer tools, check out the full MDN Tools[3] documentation.
Coming Up
In the next post in this series we will be delving into the Style Editor and the Scratchpad. Please give us your feedback on what features you would like to see explained in more detail within the comments.
Posted by Jason Weathersby, Will Bamberg and Robert Nyman [Editor] on September 24, 2013 at 6:51 am[4][5][6]
References
- ^ MDN Web Console (developer.mozilla.org)
- ^ MDN Debugger (developer.mozilla.org)
- ^ MDN Tools (developer.mozilla.org)
- ^ Posts by Jason Weathersby (hacks.mozilla.org)
- ^ Posts by Will Bamberg (hacks.mozilla.org)
- ^ Posts by Robert Nyman [Editor] (hacks.mozilla.org)